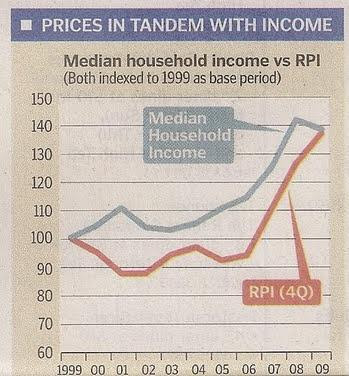
In yesterday's Straits Times article about HDB flats being affordable, there was this chart:

It shows household income rising in tandem with HDB prices.
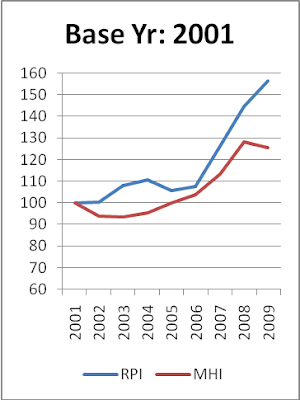
Credit goes to Hazel Poa[Link] for unveiling the trick here. Move the base year around and you get some other interesting graphs, here's one of the graphs generated by Hazel Poa:

Yes, not so "in tandem" if the base year was 2001. In fact only when you choose 1999 to be the base year instead of any other year in the last 10 years, you can show this "in tandem" movement.
Article obtained from http://singaporemind.blogspot.com/20...e-numbers.html.
It shows household income rising in tandem with HDB prices.
Credit goes to Hazel Poa[Link] for unveiling the trick here. Move the base year around and you get some other interesting graphs, here's one of the graphs generated by Hazel Poa:

Yes, not so "in tandem" if the base year was 2001. In fact only when you choose 1999 to be the base year instead of any other year in the last 10 years, you can show this "in tandem" movement.
Article obtained from http://singaporemind.blogspot.com/20...e-numbers.html.


Comment